
Mode is one of the important measures of central tendency in statistics.
The modal value is referred to as the observation which is repeated a maximum number of times in the given data set.
There are several real-life applications of mode, thus, making it essential to learn basic concepts of mode including its meaning, examples, mode formula, and properties.
What is the mode in statistics?
Mode or modal value in statistics is defined as the value the occurrence of which is maximum times in the given set of data or it can also be referred to as the observations having the highest frequency in the data set.
A particular data set doesn’t need to always have a single modal value. Sometimes there can be more than one modal value and sometimes there can be no modal value. When there are two modes in the specific set of observations then the repeated values are called bimodal values and in case there are three modes then it is called trimodal. When the number of mode values in the data set increases more than three then it is referred to as multimodal.
Mentioning some examples of mode:
Example 1: The mode of data set X = {2,3,4,4,5,9} is 4 because 4 is repeated two times in the data set.
Example 2: The modal values of data set X = {4,5,6,3,6,2,8,5} are 6 and 5 because these two values are repeated maximum times and thus, are known as bimodal.
Example 3: The modal values of data set X = {2,9,8,9,5,3,5,2,7} are 2,5 and 9 because these three values are repeated maximum times and thus, are known as trimodal.
How mode is calculated in statistics?
To calculate the value being repeated maximum times in the specific set of observations we need to use the formula of mode. If an ungrouped data set is given, then in such case mode can be calculated by just visually analyzing the observation being repeated maximum time in the particular set of data. But to calculate the mode of the grouped data set, the below-given formula will be used:
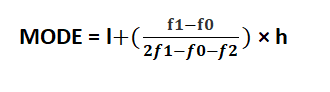
Where,
l = lower limit of the modal class
h = size of the class interval
f1 = frequency of the modal class
f0 = frequency of the class preceding the modal class
f2 = frequency of the class succeeding the modal class
Mentioning some properties of mode:
- The mode is an average that can be used to find the ideal size of the given set of observations.
- The mode is considered as the measure of central tendency that can be easily computed.
- The value of mode can also be computed for the qualitative data set.
- It is not mandatory for a data set either grouped or ungrouped to have a single value of mode. There can be more than one mode and even no mode.
- The mode is not affected by either extremely high or extremely low values, also known as extreme values.
- The value of mode is not calculated on every observation given in the set of data.
- It is possible to calculate the value of the mode graphically.
- It is not important to know the class limits when calculating the value of mode in open-end distributions.
- Fluctuations in sampling can affect the value of the mode.
Bottom Line
Through this article, you will learn the basic concepts of mode. If you want to learn other statistical concepts such as mean in an easy language then you can have access to the live classes provided by Cuemath. It is an online educational platform that is providing an after-school math program to students so that they can understand different mathematics concepts.