There are many people in this world who are not at all aware of the term Gantt charts. Gantt charts are nothing but a visual view showing the task which has been scheduled for overtime. There are various uses of this Gantt charts and one such important use is to plan different sized projects and it also gives a better idea of the work that is to be performed for a specific day. With the help of one easy view, you can easily be able to see the end as well as start dates for the required project.
Some feature which you can notice and get information with the help of Gantt charts are seeing the starting and ending date of the project, the task of the project, starting and ending of each and every task, time taken by each task and also grouping and linking of each task. In recent days people create this kind of Gantt charts with the help of excel or by project management software which may also be known as the Gantt chart software.
The online Gantt chart software
The project management, project planning or project scheduling software is the other name for Gantt chart software. The main function of this Gantt chart software for supporting other more advance Gantt requirements like the addition of milestones, creation of task dependencies and also to identify the way of the critical project. This software has moved from offline to online which helps everyone to create collaborative as well as shareable project plans and Gantt charts.
Desktop Gantt chart is basically for a manager who loves to plan a project on his own without sharing his plan. So for every user, this desktop version of Gantt chart offers a single but local version. It is difficult to share t to a large number of people but whereas the online Gantt chart software is having the capability to share the project planning. This sharing is possible as it is fully online and any person can also modify the plan or attach files to the plans whenever you invite them for seeing your project planning. No need of too much expense for installing the servers or license.
Generally, the Gantt charts are mostly used by project managers, Team leaders, General managers, Work managers, Scheduling managers, Marketing managers, Operations managers, CTOs and also CEOs. Long range of projects can be performed with the help of these charts which may include construction, IT, infrastructure and many more.
Creating Gantt charts
Many software options are there from where you can easily create your own Gantt charts. Some of them are mentioned below which will definitely help you in this field-
Microsoft project- There are many experienced project managers who use this kind of software for the Gantt charts and this helps them in keeping track with earned value progress and also task dependencies.
Industry related- There are many industries who are having their own prominent software for making Gantt charts which include Primavera P6 that is most common in the industry of construction. Good quality of training is required along with a great amount of cost but you will be receiving credibility from the company you are serving.
Microsoft Excel- If you are a good user of Microsoft Excel then you can easily make your required Gantt charts. Bar chart feature cab used by the users or they can draw it manually also.
Online software- Online software as discussed above is very famous and is having a large customer base with great sharing capacity as well as good speed. You have to be wise enough to choose the right software for yourself.
User manual for creating a Gantt chart
Some steps are written below which may give you a little basic idea about the way of creating Gantt charts. Follow these basic steps and gain some simple knowledge about it.
- Step 1- This step will be defining the goal and also division of the whole work takes place. Creating the table is required with the help of the given data. So before the creation of the Gantt charts, it is required to make some important prioritization and structuring of activities
- Step 2- The next step involves in the indication of time which is there for each and every task and also for the whole task. Here you will be required to set the time required for the execution of the single task and a certain period which has been specified can also be fixed. It is important to give full concentration on this as Gantt chart provides accuracy as well as logic in the planning of work.
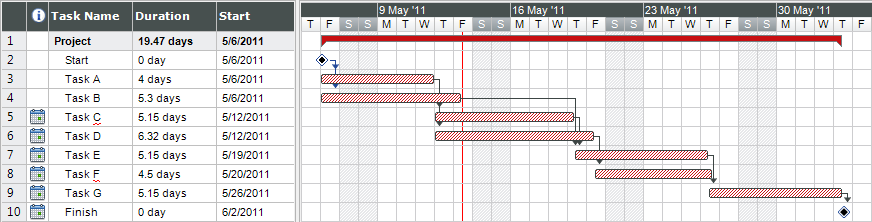
- Step 3- This is one of the important steps and this step consist of laying out all the data and using it in the Gantt chart structure. Tasks are present in the form of horizontally placed lines and length for each of the line gives an idea about the time for that task. This may be known to be the final stage of creating the Gantt chart. There are vertical lines also which shows the period taken for execution of the whole task. You can also divide one large task into many small subtasks. Color is used for highlighting these lines.
You can use Gantt Chart Excel to easily create Gantt Charts in Excel. This Gantt template is very easy to use and this will also give you idea of each and every step that your project is going through. Creating of tasks as well as linking them is also available for this software. So track the deadlines and make a proper use of it to get the very best from this software. This is similar to that o the Microsoft excel but still is made especially for the purpose of Gantt chart.
Gantt chart is not only useful for planning of business but it also finds greater use in ordinary life. In ordinary life, one can create Gantt charts for repairing something, building something or planning to buy something for the house.